 OncoScan
Pick a real slide. Our server outlines every cell nucleus in the scan, measures eight properties the lab's software would extract, runs a model trained on 569 real cases, and shows you the call, the odds, and exactly what drove it. A patient meets these numbers only through a pathology report.
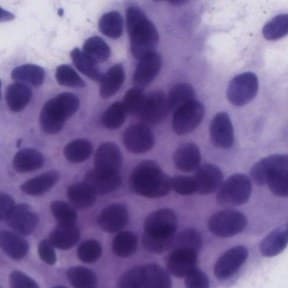 Learn to read a slide yourselfNine units on real patches from 13 hospitals, at your own pace.Thumbnail: Benign cluster, Papanicolaou stain, slide 07B8021251P. Multi-Center Breast FNAC Cytology Dataset (Patil, Jain and Sethi), Zenodo record 20763900, CC BY 4.0
- Runs on our API, not in your tab
- Eight nucleus measurements
- Every push explained
Scanned FNAC smear, 40x at 0.25 microns per pixel, so a red blood cell is about 30 pixels across: Multi-Center Breast FNAC Cytology Dataset (Patil, Jain and Sethi), Zenodo, CC BY 4.0
Pick a slide
Twelve real cytology micrographs from breast fine-needle aspirates, four benign and four malignant with four borderline fields between them. Pick one and the server measures every nucleus in it.
Scroll sideways or drag to browse. Every micrograph is from the Multi-Center Breast FNAC Cytology Dataset, used under CC BY 4.0.
The server outlines every nucleus
The eight numbers the model reads are not typed in by anyone. They are measured here, from this image, one nucleus at a time.
The call
Condensed on purpose. Every number behind it was measured from the image above.
The eight numbers, measured
All eight numbers the server took off this image, what they mean, where this slide sits among 569 real patients, and how each one pushed the call. Turn what-if on to ask how the answer would change.
Pick a slide first. The eight numbers appear once the server has measured it.
How a slide becomes a call
Six steps, all of them visible. Nothing about the measurement or the model is a black box.
A thin needle takes a sample
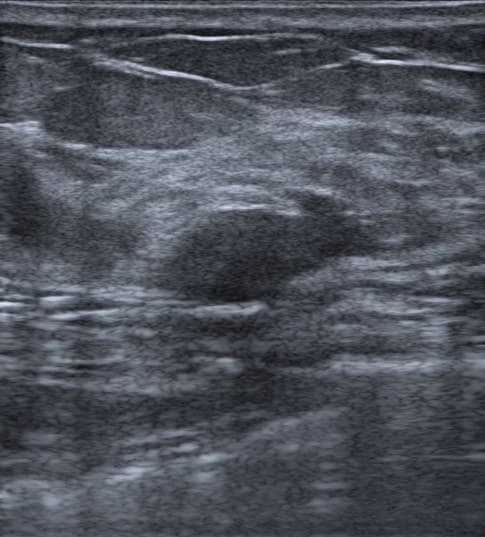
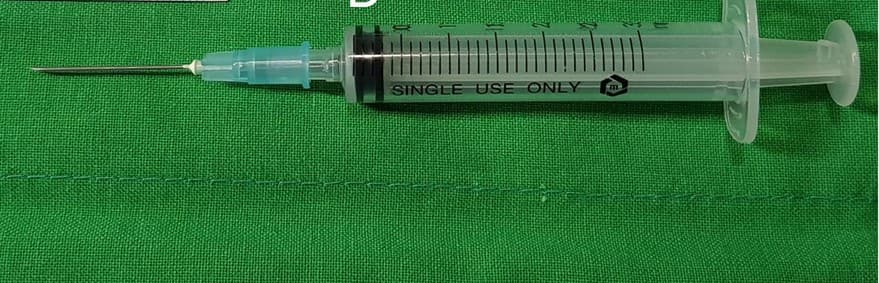
A thin needle takes a sample
A fine-needle aspirate draws a few cells from the breast mass. It is quicker and less invasive than a surgical biopsy.
The cells go on a slide
The sample is smeared on a glass slide and stained, with Papanicolaou or May-Grunwald-Giemsa, so the cell nuclei stand out from the cytoplasm around them.
The slide is photographed
A scanner digitizes the slide at 40x, a quarter of a micron per pixel. Everything after this point is measured in the pixels of that image, which is why the scale has to be declared.
The server outlines each nucleus
OpenCV picks out the darkly stained nuclei against their own surroundings, so a nucleus inside a thick sheet counts the same as one alone on the glass, pulls touching pairs apart along the narrowest waist, and traces each boundary with 64 points. This is the step you watched happen in the Measure section.
Seven numbers per nucleus
Size, outline length, area, edge smoothness, indentation depth, indentation count and interior texture, for every nucleus found. They are then summarized into the eight values the model reads, where worst means the mean of the three largest.
Our server runs the model
A logistic regression fitted to 569 real cases turns those eight numbers into a call, the odds, and how much each number pushed. Nothing runs in your browser.
About the model, the images, and the backend
A small model with every weight in the open, fitted to 569 real cases, fed by a segmentation pipeline that runs on our API.
Where the numbers come from
A fine-needle aspirate is a thin-needle sample of a breast mass. It is photographed under a microscope, the image is digitized, and software outlines each cell nucleus and measures it. All lengths are in pixels of that scan, so they are relative, not micrometers.
What “worst” means
The mean of the three largest values across all nuclei in the image, so it captures the most abnormal cells rather than the average.
What the model is
A logistic regression on eight of the thirty published measurements, standardized to the dataset’s mean and spread. Its eight weights and its intercept live on our server; every push shown in the drivers panel is that weight times how far the value sits from the average patient.
Test accuracy
97.4%
compact 8-feature model (98.25% with all 30 features)
ROC AUC
0.997
ranking quality, 1.0 is perfect
Sensitivity
97.6%
of malignant cases caught
Specificity
97.2%
of benign cases correctly cleared
Fitted and evaluated on the same 569 patients, so this is in-sample.
10-fold cross-validation: 98.1% ± 1.5%. Held-out test set from the same 569 patients.
Where the images come from
Multi-Center Breast FNAC Cytology Dataset, Patil, Jain and Sethi, Zenodo 20763900, CC BY 4.0. 7,393 patches from 470 whole-slide images, Papanicolaou and May-Grunwald-Giemsa stained, scanned at 40x and 0.25 microns per pixel.
Twelve patches are curated here: four benign, four malignant, and four borderline fields, both stains, each one sharp enough for the pipeline to separate its nuclei. The full attribution is in public/samples/LICENSE.txt and under every micrograph on the page.
Zenodo record 20763900What C1 to C5 mean
C2 to C5 are the cytologist’s reporting categories, filed when the slide was read. The model’s call is a separate estimate made from eight numbers, and the two are not the same kind of statement. For C3 and C4 the cytologist deliberately did not commit, so there is no right answer for the model to agree with.
- C1 insufficient
- Too few cells to report on. These are excluded from this site entirely.
- C2 benign
- The cytologist saw a benign picture.
- C3 atypical
- Probably benign, with features that are not quite ordinary. No binary answer exists for these.
- C4 suspicious
- Probably malignant, but short of the certainty the cytologist needs to say so.
- C5 malignant
- The cytologist saw a malignant picture.
How we calibrated
Fitted once on the 4 benign reference images so their medians match the dataset's benign medians, then frozen. A clinical version would calibrate against slides measured by the original system. Nothing in this table was ever fitted on a C3, C4 or C5 image.
| Measurement | Scale | Offset | Why it needs one |
|---|---|---|---|
| Lengths (radius, perimeter) | 1.78352 WDBC px per micron | 0 | The Wisconsin images were digitized at a magnification the dataset never published, so a length in our pixels is not a length in theirs. |
| Area | 3.1809 WDBC px² per micron² | 0 | Areas scale by the square of the length factor. |
| Smoothness | 1 | 0.0975504 | Scale-free, but it depends on how the boundary was traced, which is a different method here. |
| Concavity | 1 | -0.0148304 | Scale-free, but it depends on how the boundary was traced, which is a different method here. |
| Concave points | 1 | -0.00121083 | Scale-free, but it depends on how the boundary was traced, which is a different method here. |
| Texture | 1 | -2.04567 | Gray-level spread depends on the stain, the camera and the bit depth, so it needs its own correction. |
POST /api/measure
The image goes to our API. OpenCV segments every nucleus, measures seven properties of each one, aggregates them into the eight the model reads, and hands them straight to the model. The browser draws the outlines it gets back.
Waiting for the first call of this session.
POST /api/analyze
Eight measurements in, one explained call out. This is the endpoint the what-if sliders use; the model runs there and returns the odds and the per-measurement pushes.
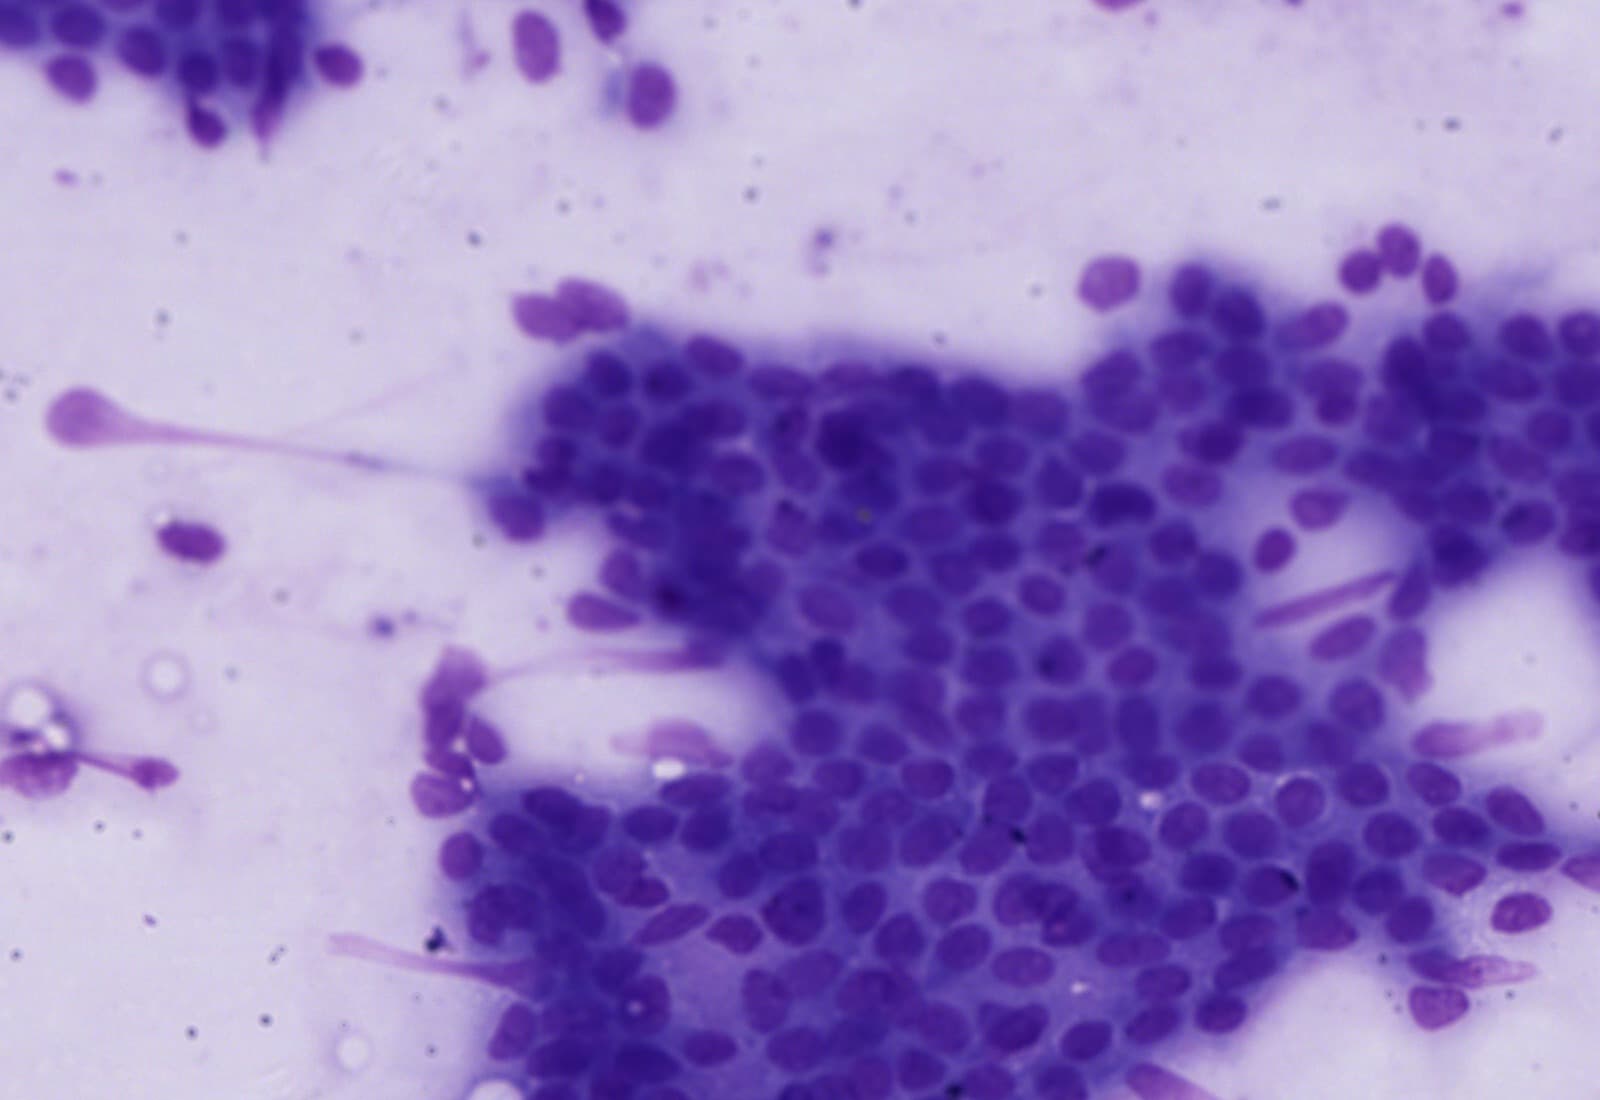
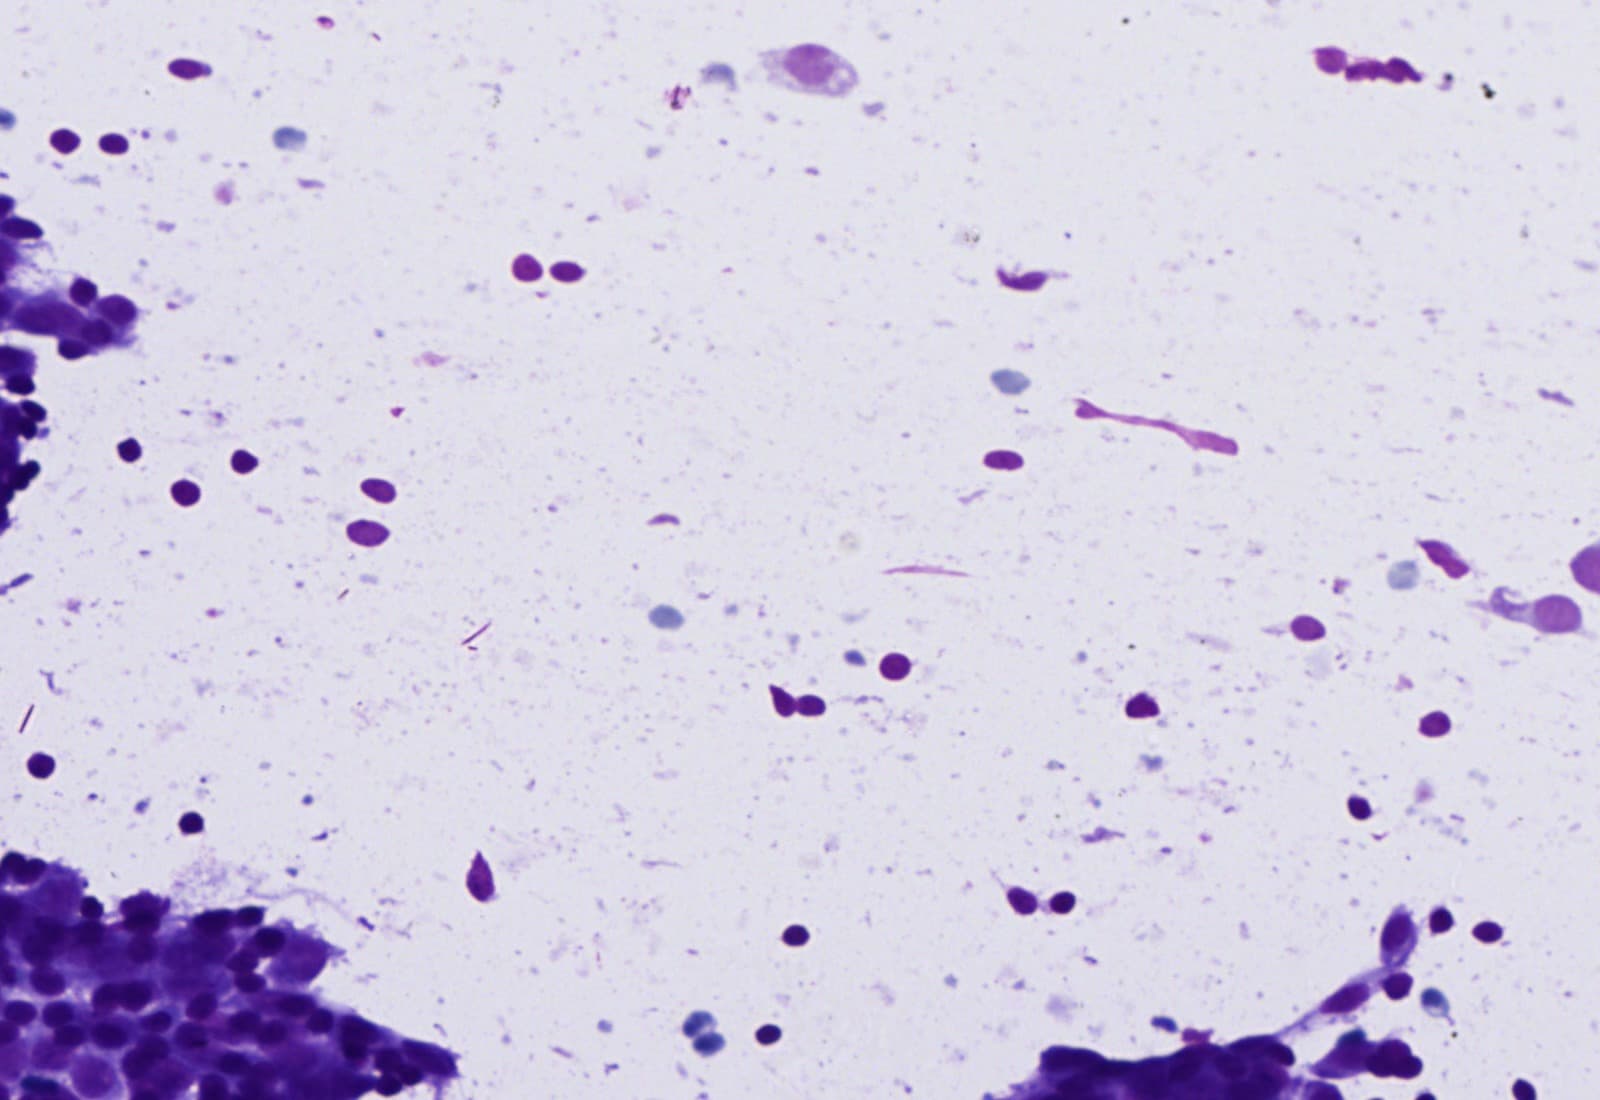
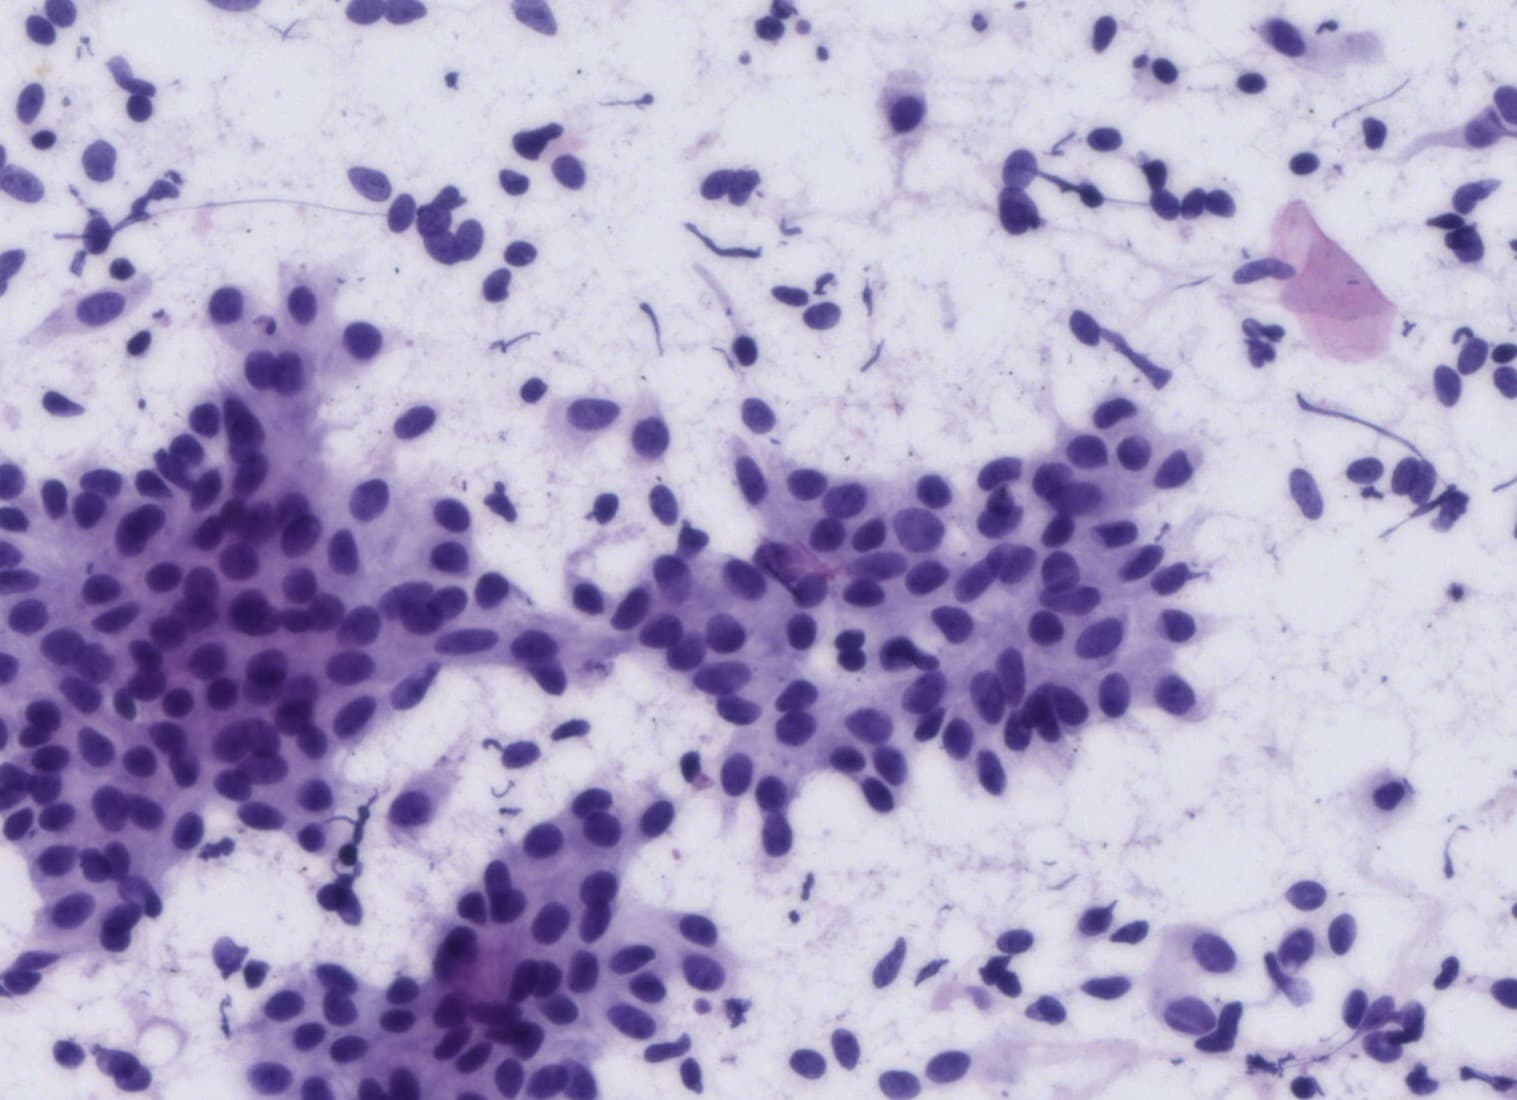
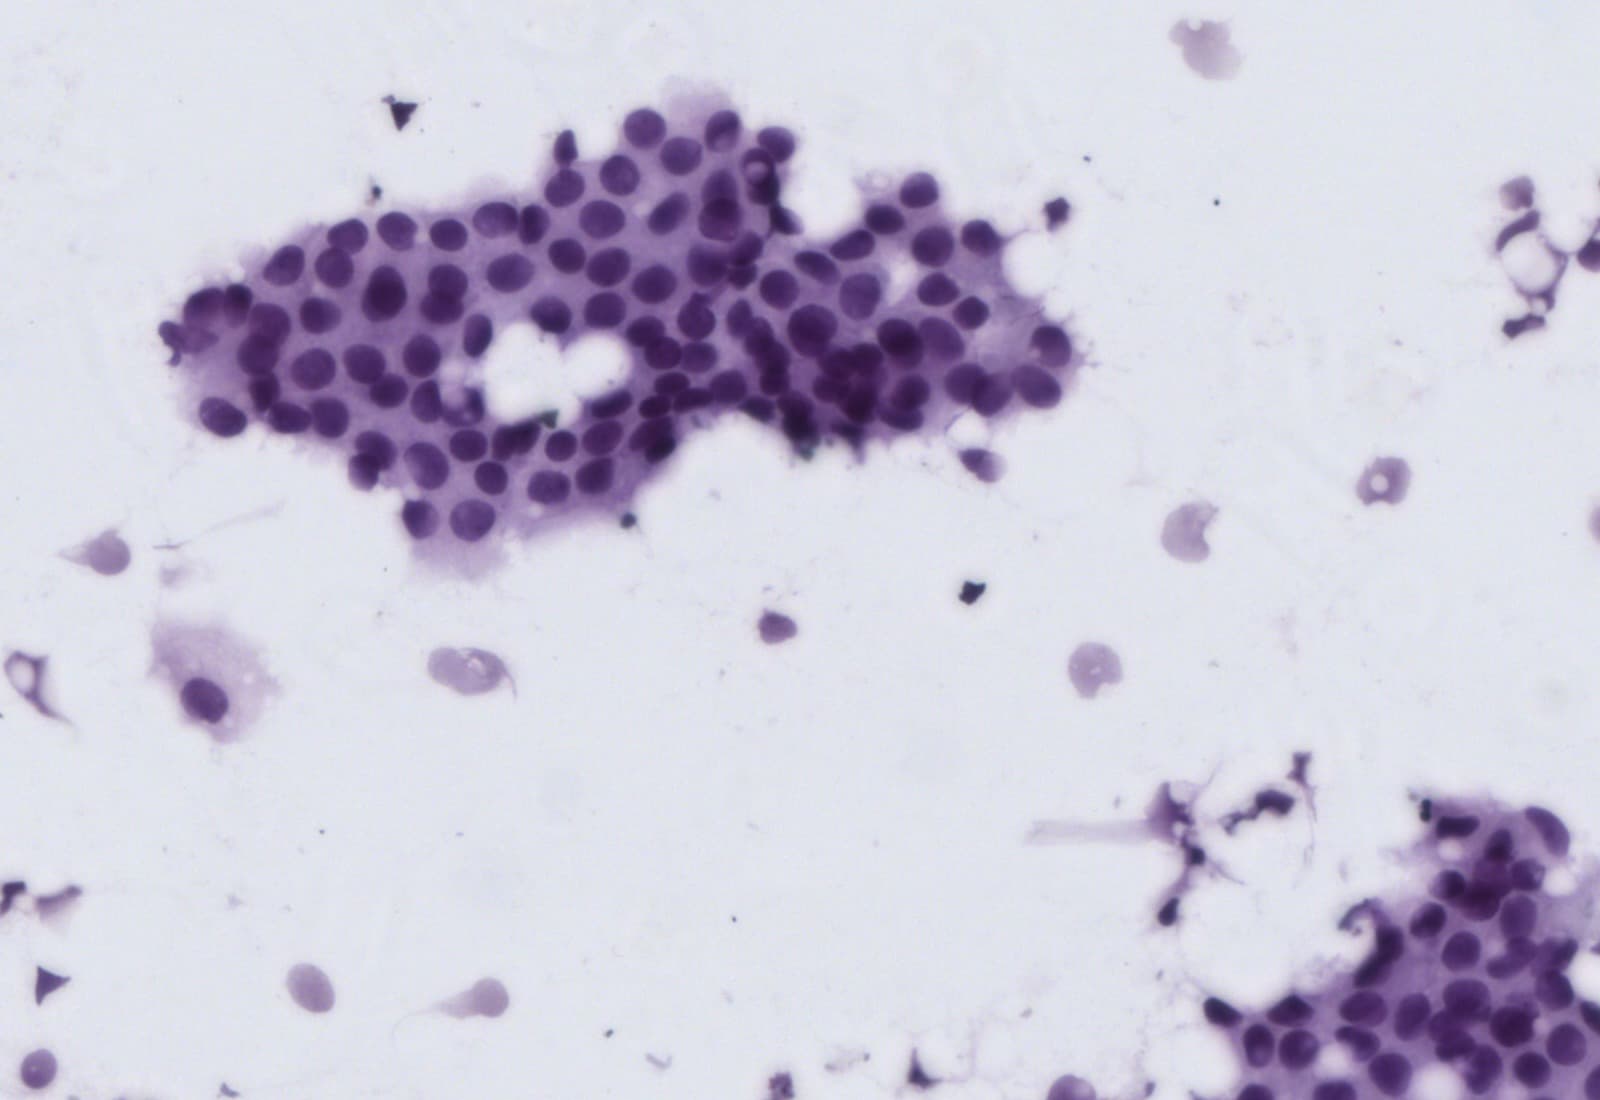
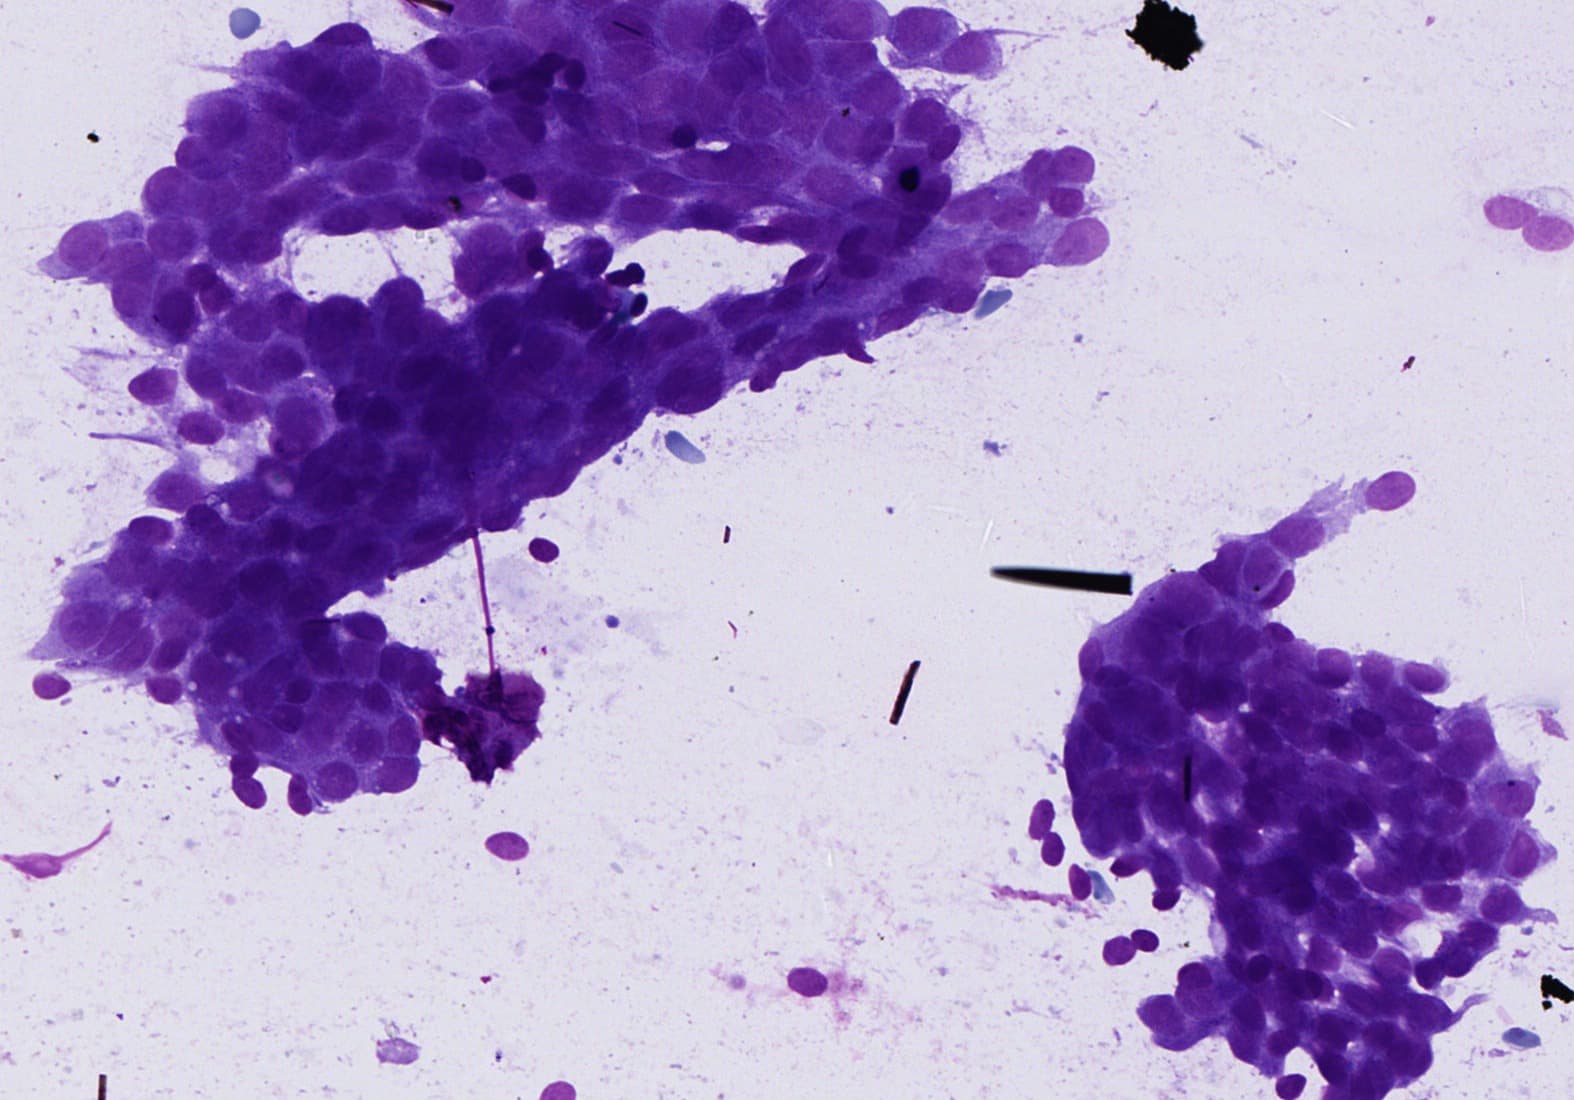
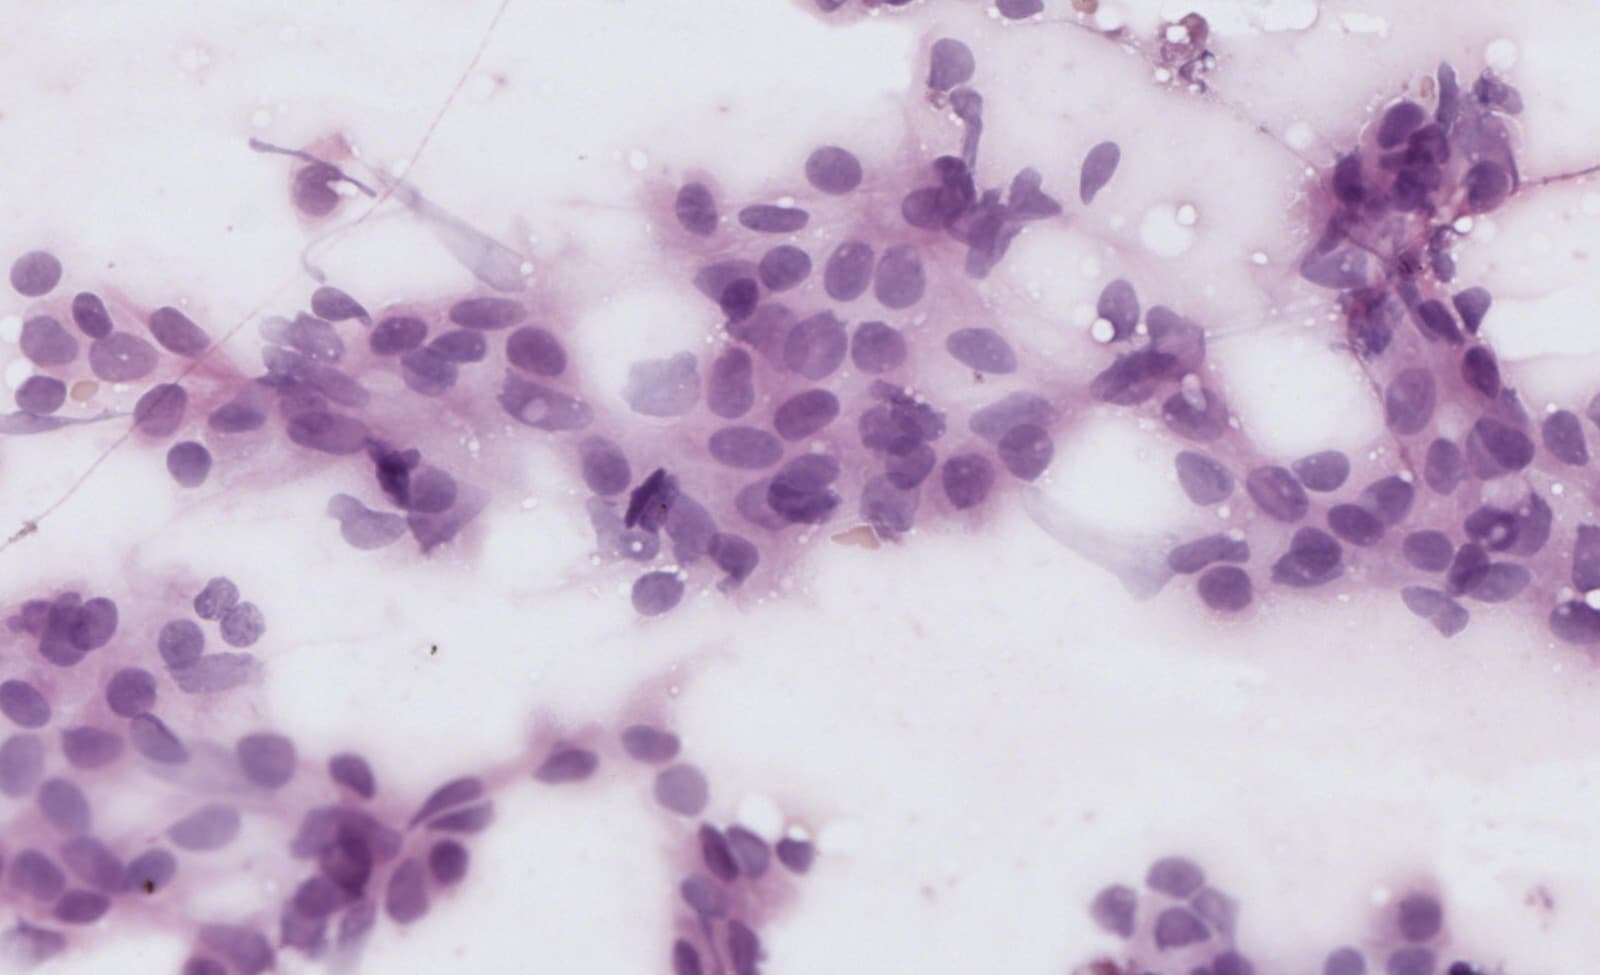
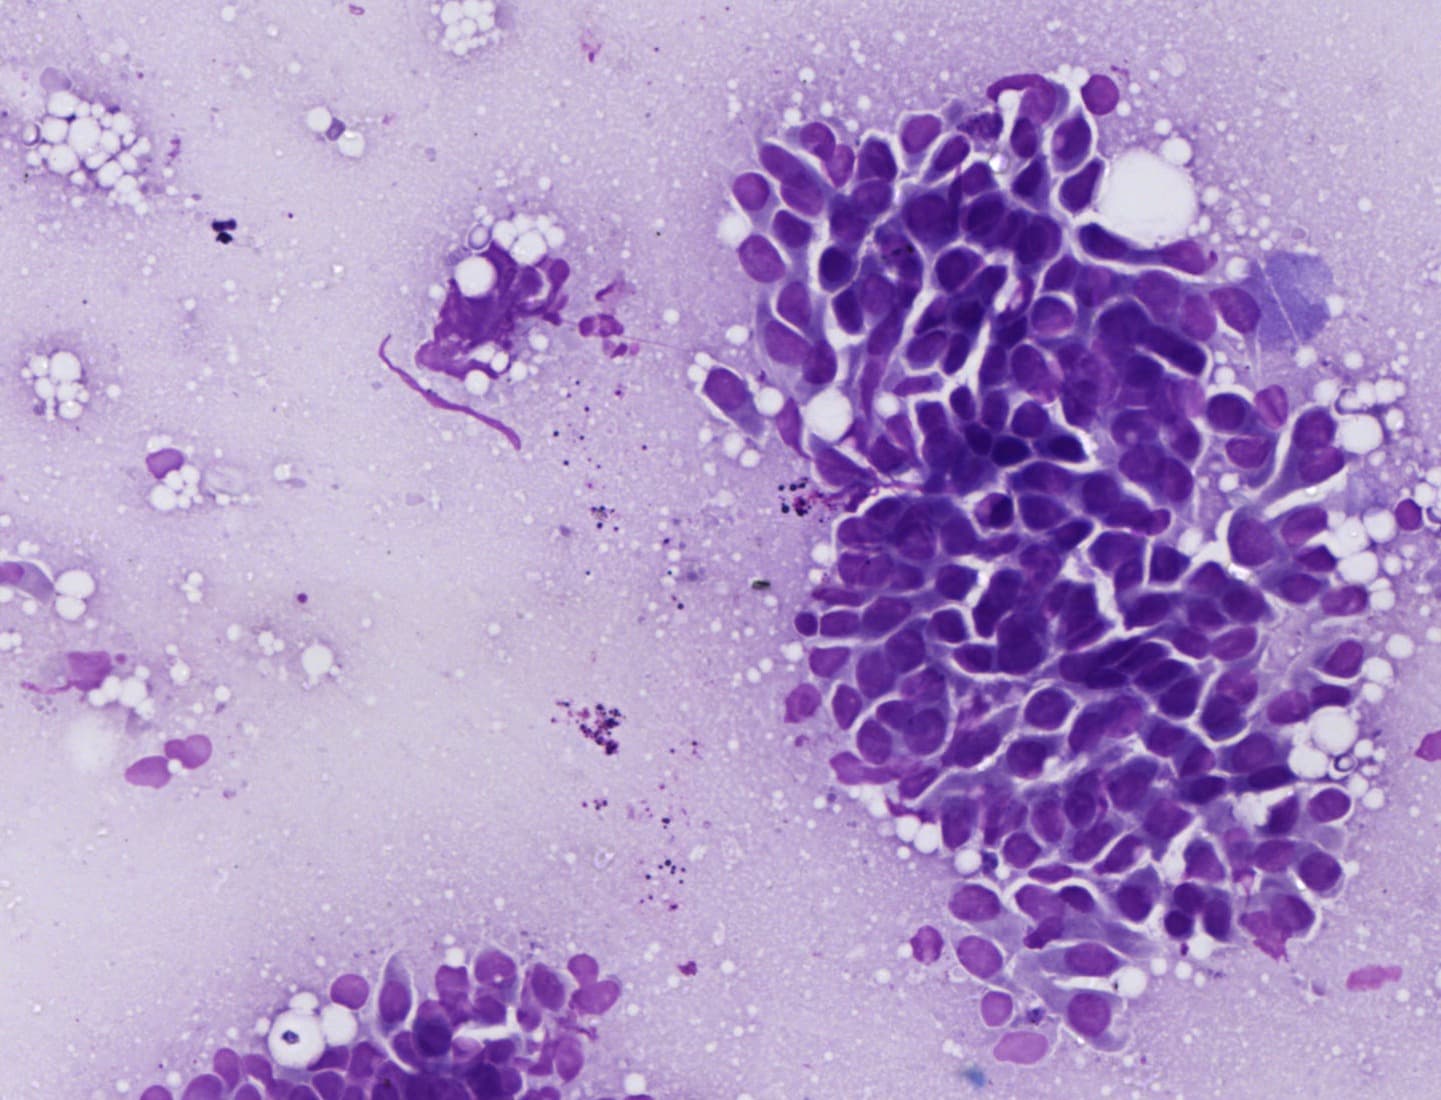
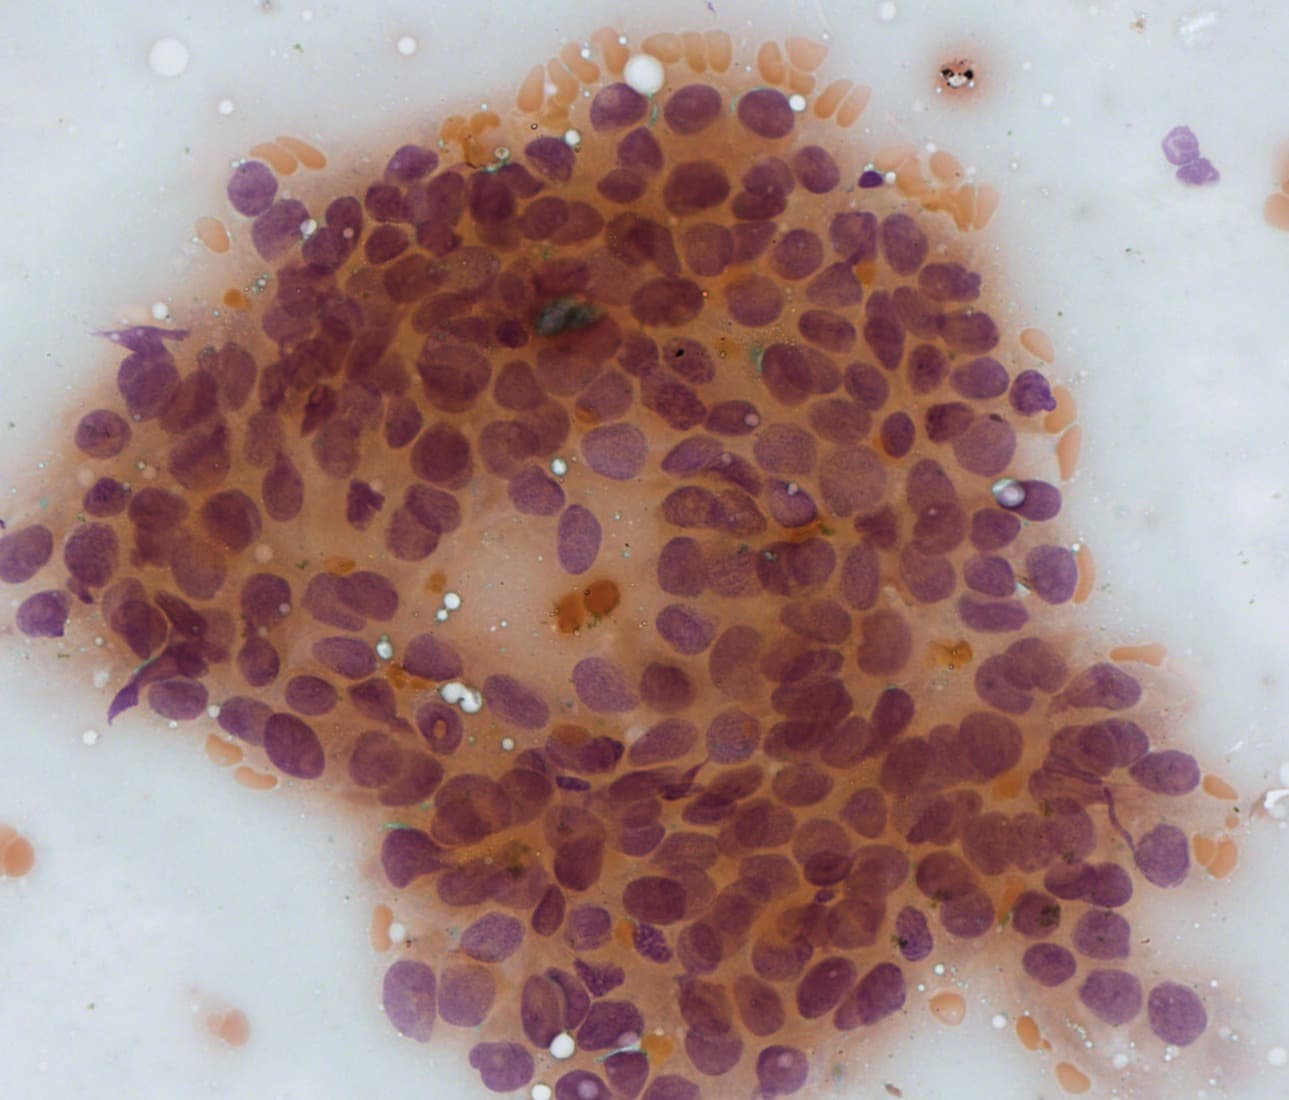
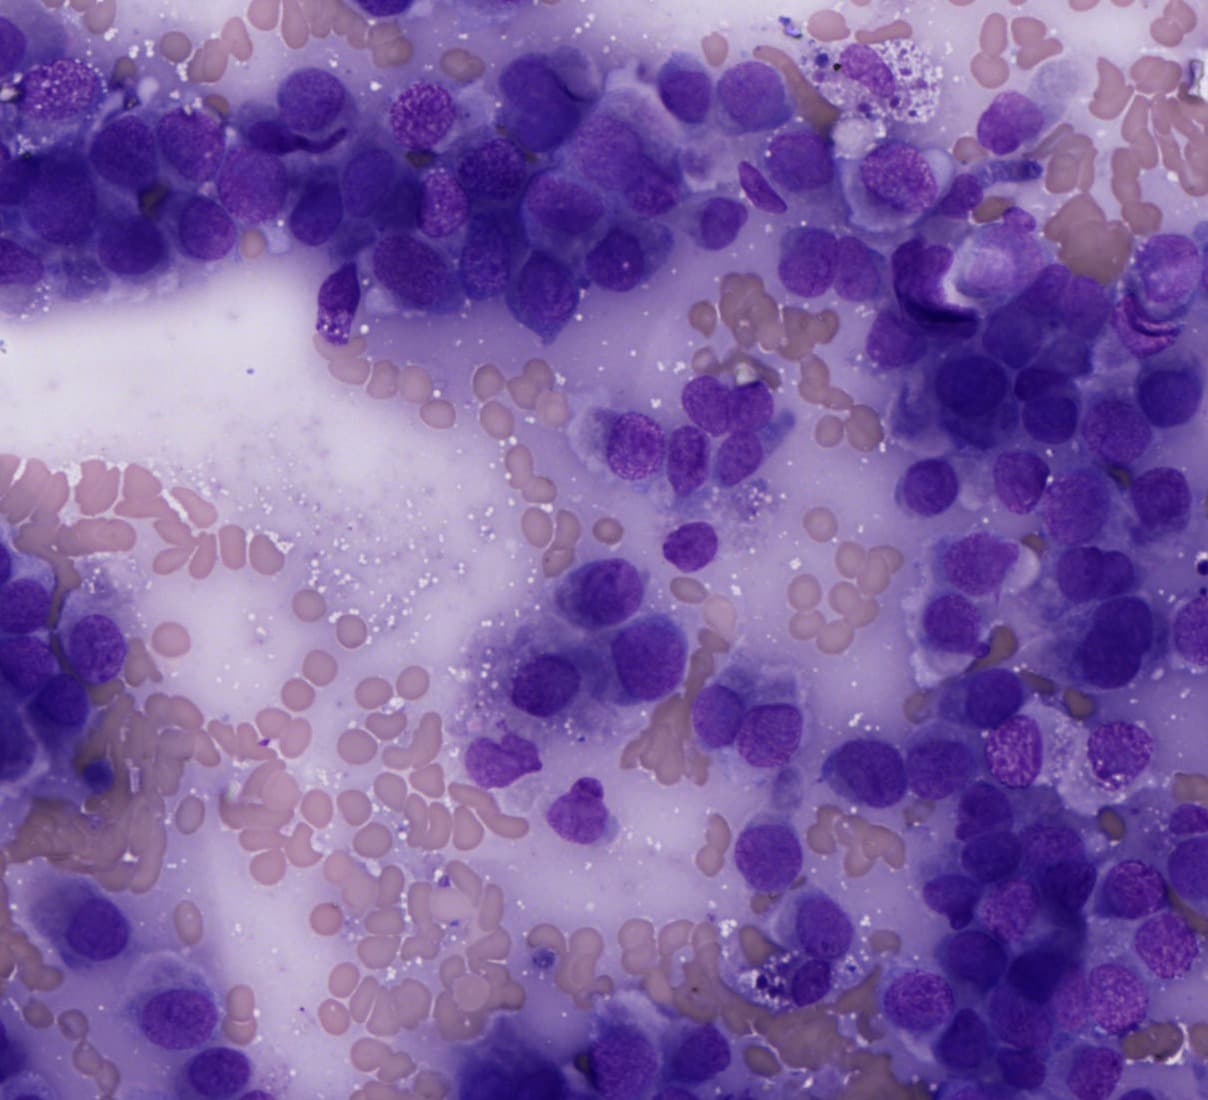
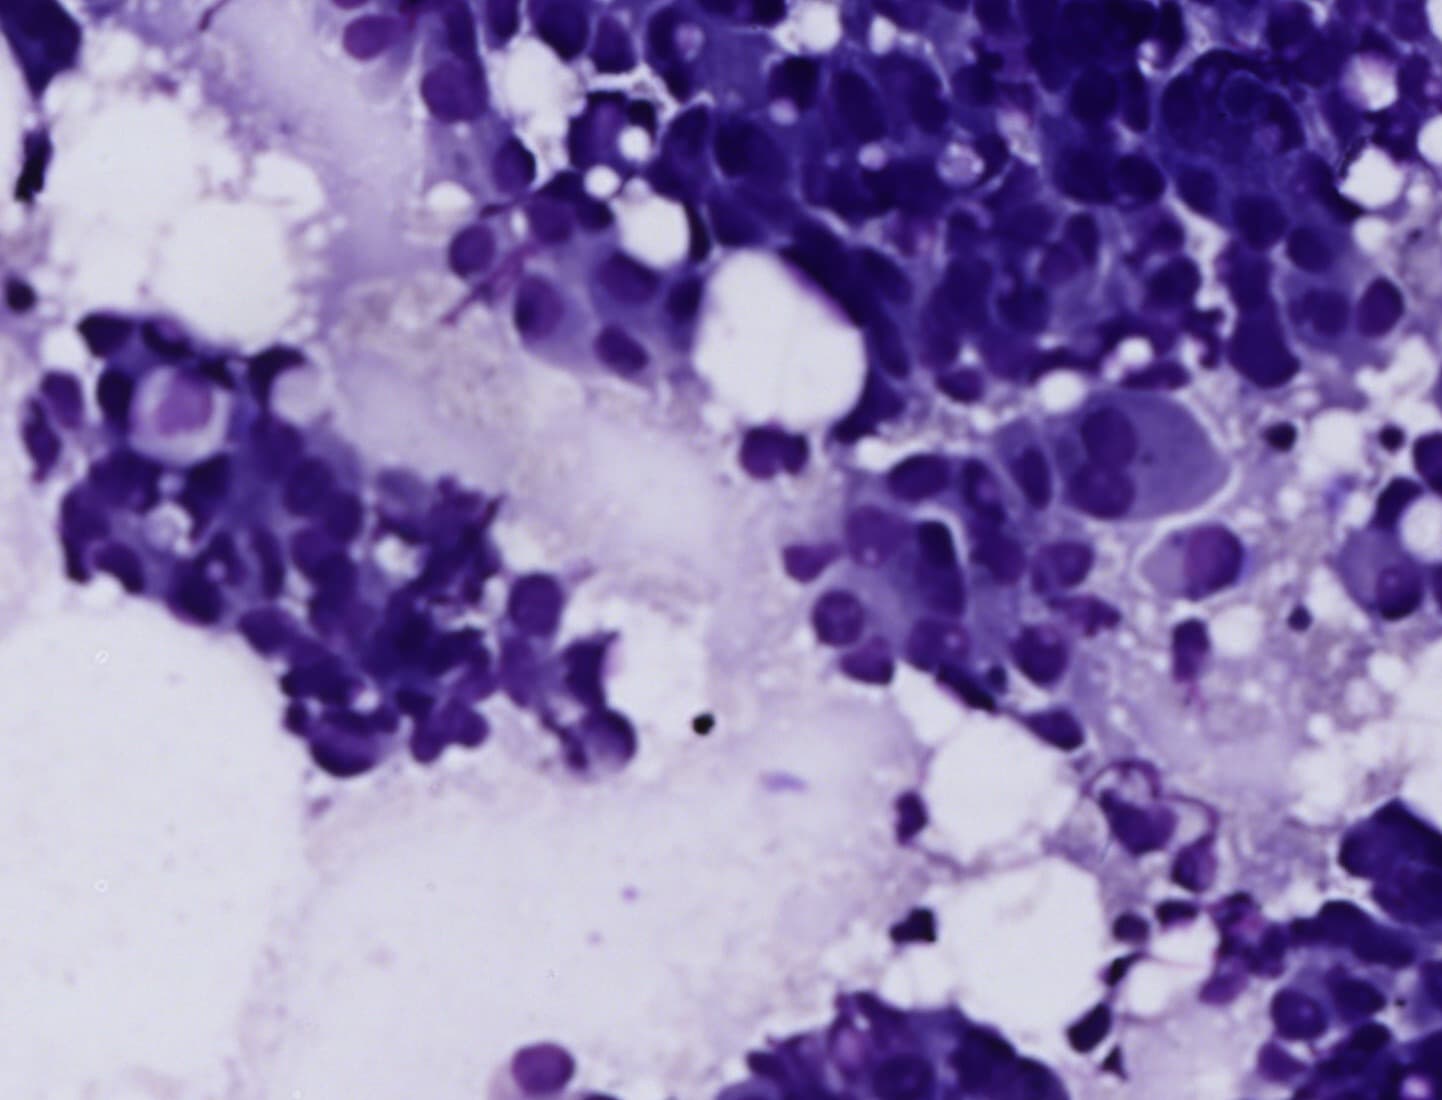
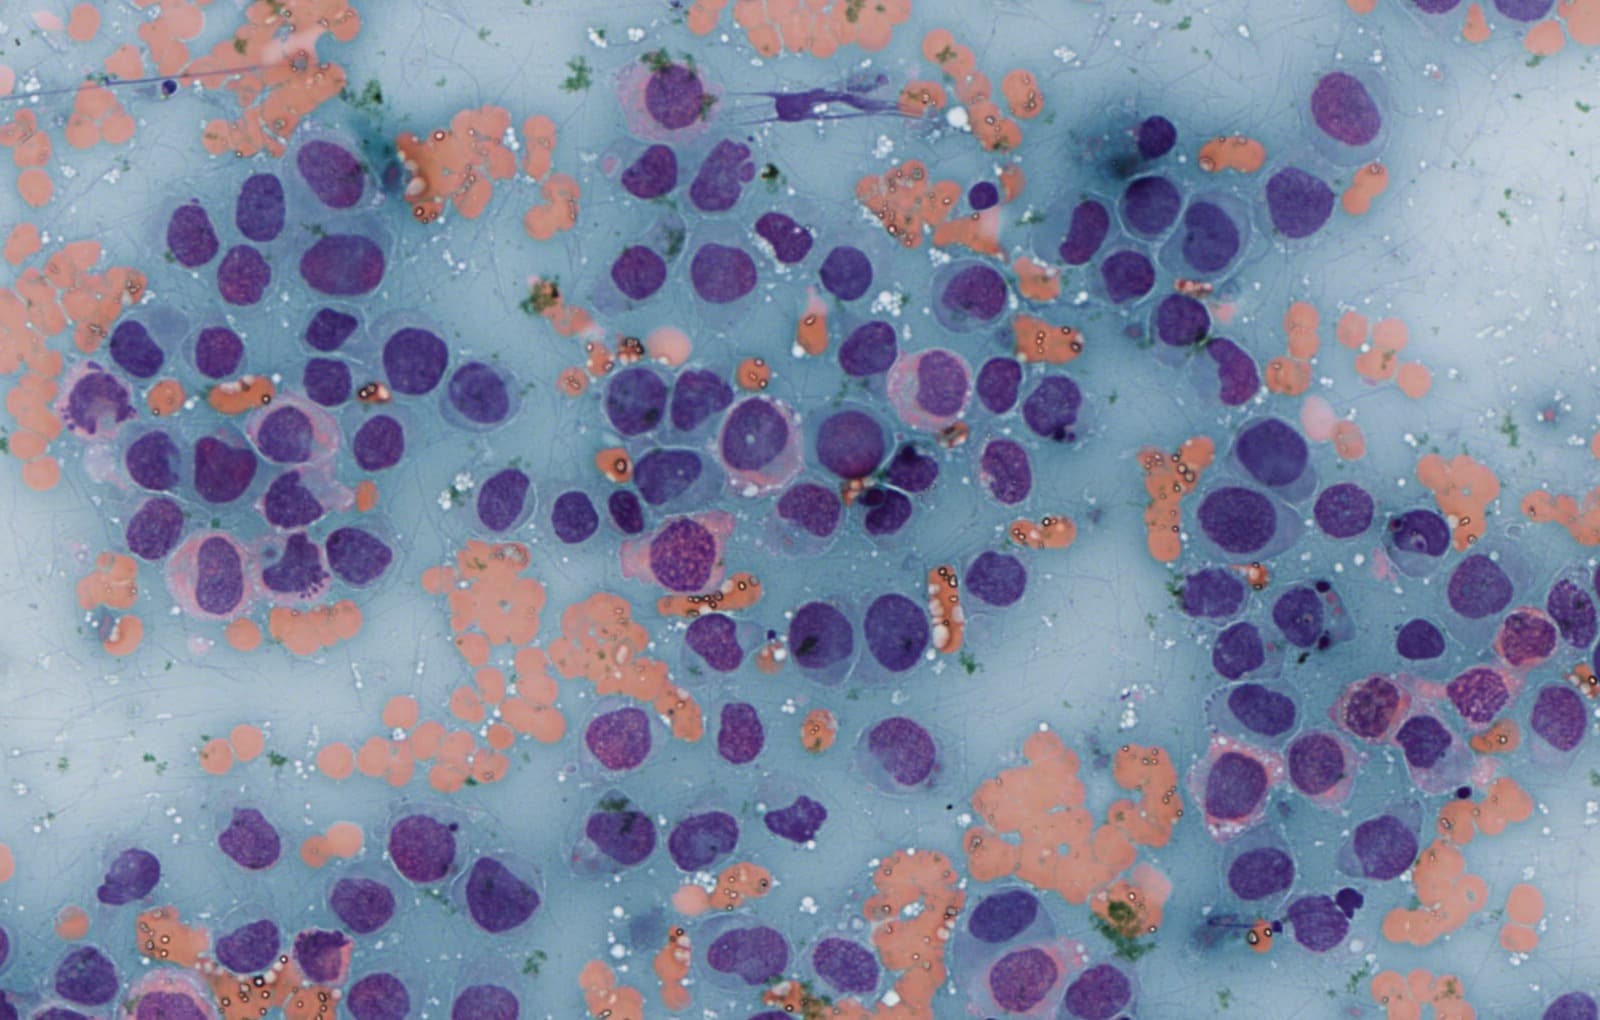
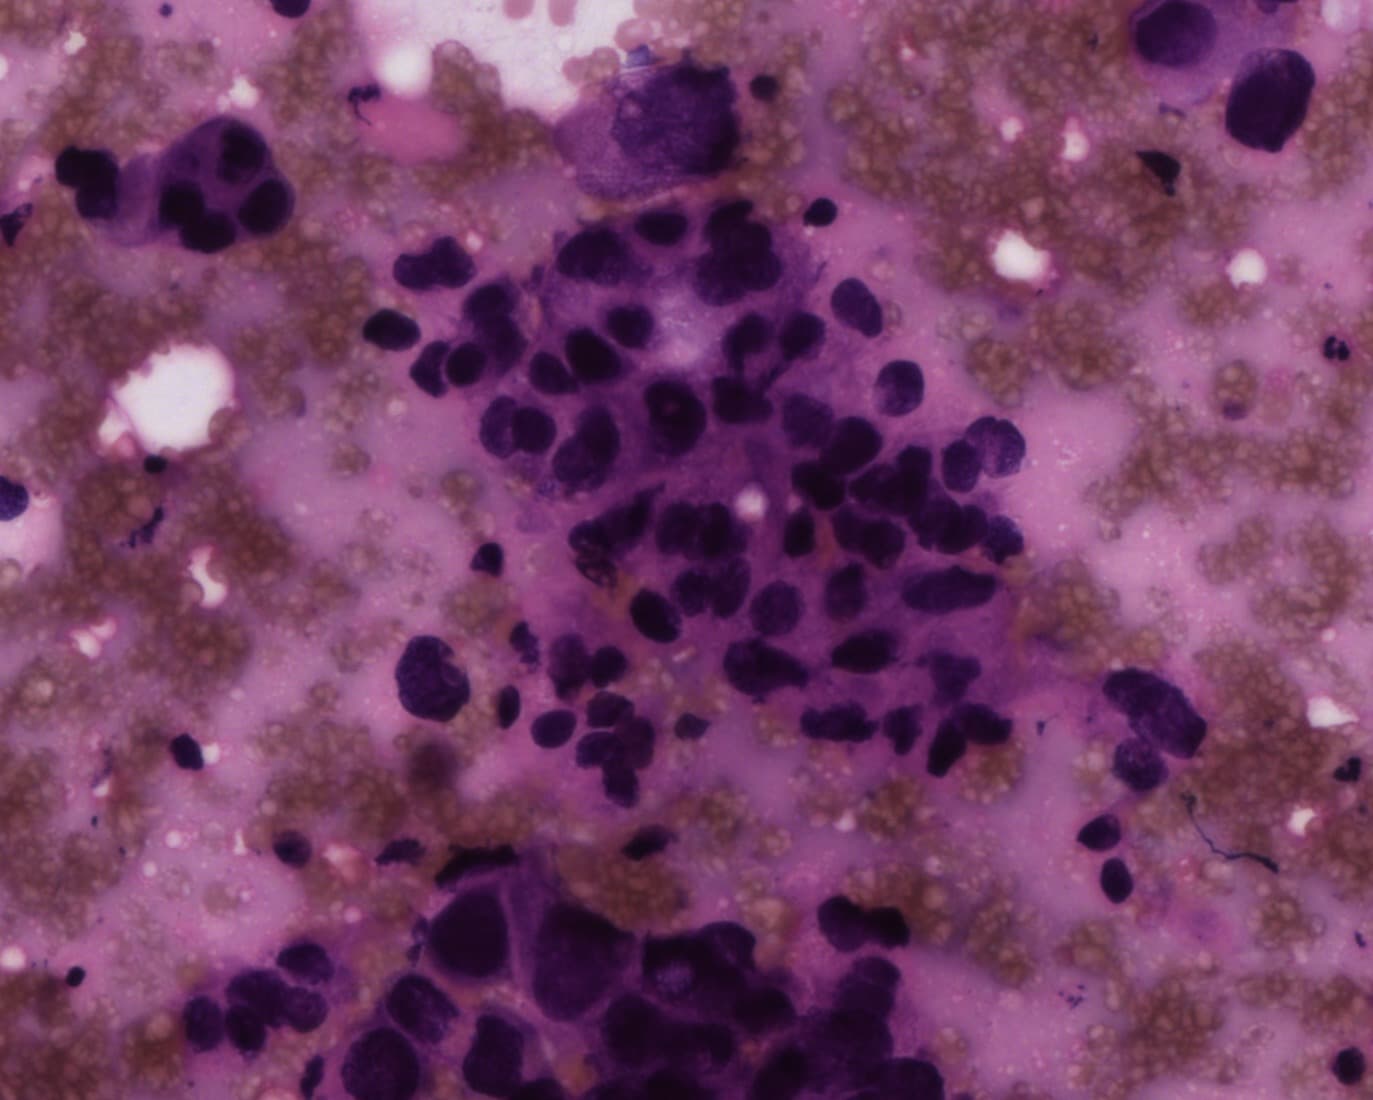
Multi-Center Breast FNAC Cytology Dataset (Patil, Jain and Sethi), Zenodo record 20763900 · CC BY 4.0
GET /api/samples
The curated micrographs, with the stain, the cytologist's category, the scale in microns per pixel and the credit attached.
Nothing is stored
An uploaded image is decoded in memory, measured and dropped. No accounts, no tracking, no images written to disk.